Spatial distribution of cannabinoid content within a plant
Background:
Both cultivators and Brightlabs are members of the Cultivation for Compounds (CfC) consortium. This consortium, comprised of major companies within the horticultural industry, was established to facilitate research into the cultivation of medical cannabis and its beneficial compounds.
The CfC has found a reliable and consistent partner in Brightlabs for analyzing the quality of the produced flower. In the CfC’s independently developed sampling protocols, a mixed sample is collected from all parts of the plant before being sent for analysis. To verify the accuracy of this protocol for our cultivation setup, questions arose regarding the distribution of cannabinoids across different parts of the plant. It is known that cannabinoid levels can vary depending on flower position, cultivar, lighting, and many other variables. Therefore, it is important to gain insight into these differences so they can be accounted for.
Objective:
Verify the sampling protocol developed for the CfC’s specific cultivation setup.
Experimental setup:
A representative plant from the reference treatment of the winter 2023 research cultivation cycle was selected for further analysis. The plant was grown in a high-
tech greenhouse in the Netherlands, where the CfC consortium conducts its experiments. The greenhouse is equipped with a gutter cultivation system, pressure-compensated drip irrigation, and an active climate control system including CO2 supplementation. A dynamic LED system ensured a consistent light intensity of 1000 µmol/m2/s on the crop. The reference treatment was grown on stone wool.
The plants were topped 8 days into the vegetative phase and maintained with 6 branches. The vegetative phase lasted 10 days, and the flowering phase lasted 8 weeks. A pruning step was performed 2 weeks after switching to short-day conditions. Netting was used to support the heavy, flower-bearing branches. This strategy results in a compact crop with an even canopy.
The variety used was “OG Blitz,” which produces dense flower clusters with THC percentages between 25% and 30%.
At the time of harvest, the plant size, weight, and branch locations were recorded. Each of the 6 branches was then split in the middle, and the flowers were labeled as belonging to either the top or bottom half of their respective branch. The flowers were labeled and dried separately. After drying, the flower samples were sent to Brightlabs for cannabinoid content analysis.
Results:
Brightlabs analyzed the samples for the presence of 17 different cannabinoids. Cannabinoids below the limit of quantification have been omitted from the discussion. The “Δ9-THC equiv.” column is calculated by multiplying the amount of THCA by 0.877 and adding the amount of Δ9-THC.
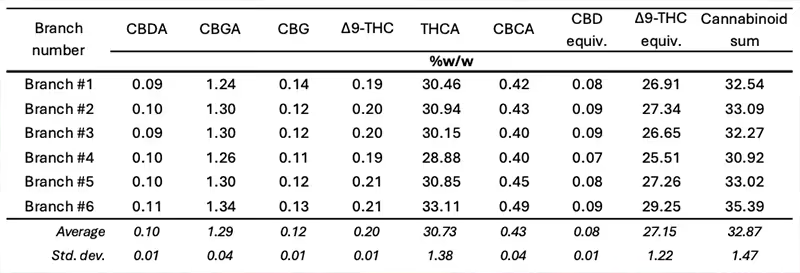
The potency of the OG Blitz variety is confirmed with consistent THC percentages between 25% and 30%. The average Δ9-THC across all branches is 27.2 ± 1.2%, representing a deviation of less than 10% in Δ9-THC content. This same trend is reflected in the sum of all measured cannabinoids in the final column. However, the maximum difference in Δ9-THC is approximately 4%, demonstrating that the total plant average differs from the potency of individual flowers. This indicates that a single flower should not be considered representative of the batch or even the entire plant, highlighting that creating a proper mixture is key to obtaining a representative sample for analysis.
Screenshot
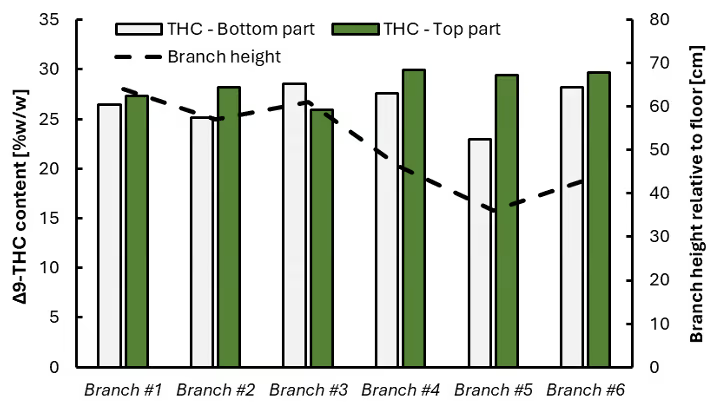
Next, we will take a closer look at the data by separating the branch averages into their top and bottom sections. Now we can see that there are only minor differences in Δ9-THC between the top and bottom section for all branches (except branch #5). On the secondary axis, the height of the top of the branch relative to the floor is plotted. There is no clear relation between the height of the branch and the average Δ9-THC content in the flower. Interestingly, the Δ9-THC content of the top part of the branches seems to increase slightly when the branch height decreases. The Δ9-THC content of the bottom part of the branches seems to remain constant, except for branch #5, no matter the height of the branch relative to the floor.
Discussion:
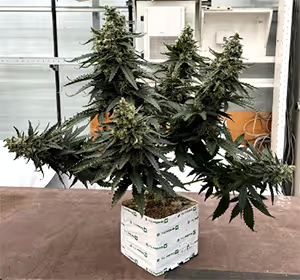
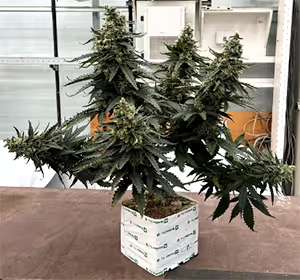
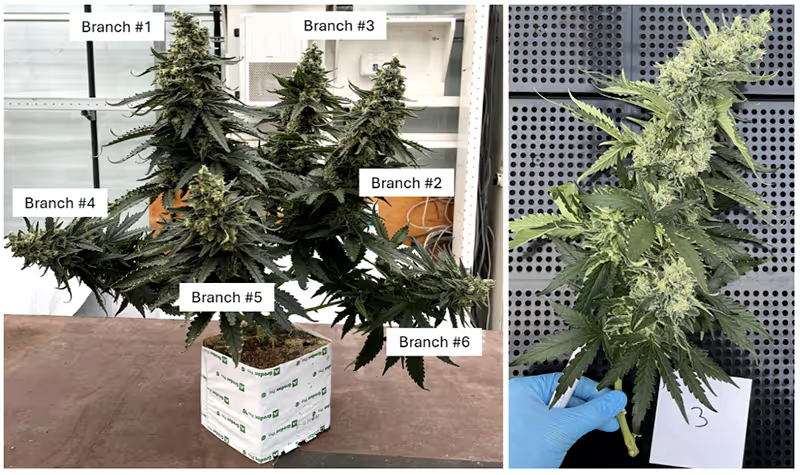
The difference in height from the floor between the highest and lowest branch was only 28 cm, meaning that a very compact structure was achieved (photo on the left). Also, with the pruning and trellising strategy, equal flower development between the top and bottom parts of branches was realized (at least visually) (photo on the right).
In total, 12 analyses (2 per branch, 1 for the top and 1 for the bottom section) were conducted on this plant. The analyses showed consistent Δ9-THC percentages, proving the effectiveness and consistency of the cultivation strategy as well as the analysis techniques. These analyses prove that the difference in cannabinoid content of flowers from different parts of the plant is relatively small, less than 10% deviation from the plant average, in our cultivation system. Nevertheless, the highest difference in Δ9-THC content was 4% between branches, showing the necessity of creating a representative mixed sample for analysis instead of relying on a single flower.


Science is only as good as the people behind it.

Brightlabs was founded on a simple belief: that analytical chemistry is most valuable when driven by genuine scientific curiosity and a commitment to doing things the right way.
The complete overview of what Brightlabs does.
Download our brochure for a complete overview of our analytical capabilities, services, and scientific approach.